October 15, 2019
We want to know how you use rOpenSci packages and resources so we can give them, their developers, and your examples more visibility.
It’s valuable to both users and developers of a package to see how it has been used “in the wild”. This goes a long way to encouraging people to keep up development knowing there are others who appreciate and build on their work. This also helps people imagine how they might use a package to address their research question, and provides some code to give them a head-start.
We have a dedicated Use Cases category in our public discussion forum and we encourage you to browse and add to it. As of September 2019, there are > 50 use cases, covering > 30 packages. More than half of these have been added by community members. These complement the > 800 citations of our tools in published works.
 Examples
-
visdat1, skimr2, assertr3, Exploring and understanding a new data set. Sharla Gelfand used these packages to demonstrate how she approached a data set on public transit delays. She shared her code, slide deck, and an explanatory blog post. [Use case].
-
nasapower4, rnaturalearth5, Can rainfall be a useful predictor of epidemic risk across temporal and spatial scales? Emerson Del Ponte worked with Adam Sparks to access rainfall data for a specific time period of soybean growth over multiple seasons in two states in Brazil. It’s being used to explore associations between rainfall and patterns of dispersal of a soybean fungal disease. Adam shared the code he used to access the data and create the maps for the presentation Emerson shared [Use case].
-
rOpenSci package development guide used in teaching and manuscript review6. Tiffany Timbers, her teaching assistants, and students used our guide in teaching and evaluation in their Collaborative Software Development course in the University of British Columbia’s Master of Data Science program [Use case]. Hao Ye used the guide in his review of a manuscript that included an R package [Use case].
Browse the use cases for applications in academia, industry, government, or “just for fun”, with examples on biodiversity, ecology, text processing, bibliometrics, workflows and reproducibility, weather, public health, bicycle networks, agronomy, epidemiology, surveys, seafood mislabelling, tweets about fires, and others!
 What’s your use case?
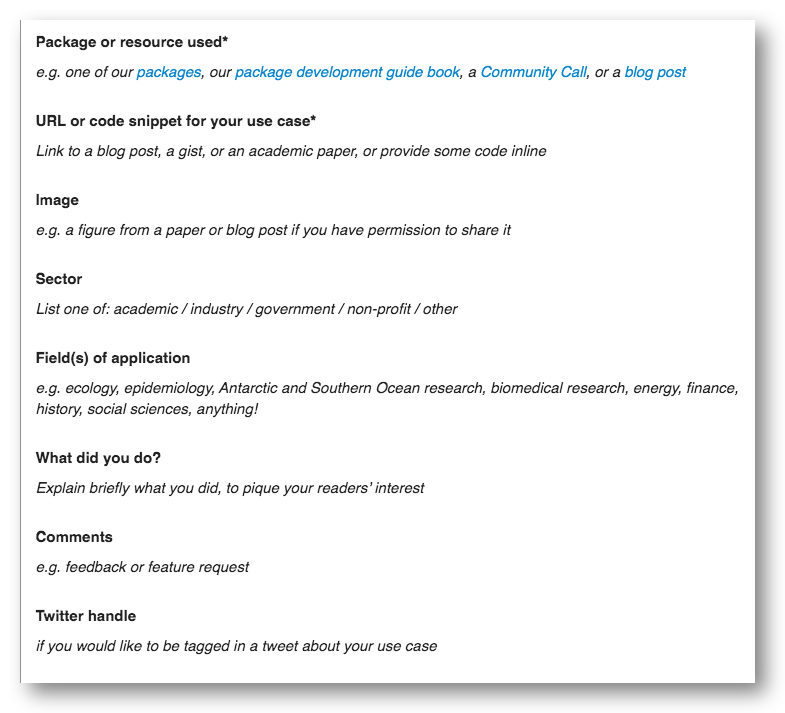
If your use case is published on the web somewhere, please tell us about it in the forum. Here’s the template we created to guide you.

When you post your use case in the forum we’ll tweet about it from @rOpenSci and we might feature it, with attribution, in our biweekly newsletter.
Developers and users will thank you!
-
Nicholas Tierney (2017). “visdat: Visualising Whole Data Frames.” JOSS, 2(16), 355. doi: 10.21105/joss.00355 (URL: https://doi.org/10.21105/joss.00355), <URL: http://dx.doi.org/10.21105/joss.00355>. ↩︎
-
Elin Waring, Michael Quinn, Amelia McNamara, Eduardo Arino de la Rubia, Hao Zhu and Shannon Ellis (2019). skimr: Compact and Flexible Summaries of Data. R package version 1.0.7. https://CRAN.R-project.org/package=skimr ↩︎
-
Tony Fischetti (2019). assertr: Assertive Programming for R Analysis Pipelines. R package version 2.6. https://CRAN.R-project.org/package=assertr ↩︎
-
Adam Sparks (2018). nasapower: A NASA POWER Global Meteorology, Surface Solar Energy and Climatology Data Client for R. Journal of Open Source Software, 3(30), 1035, https://doi.org/10.21105/joss.01035 ↩︎
-
Andy South (2017). rnaturalearth: World Map Data from Natural Earth. R package version 0.1.0. https://CRAN.R-project.org/package=rnaturalearth ↩︎
-
rOpenSci, Brooke Anderson, Scott Chamberlain, Anna Krystalli, Lincoln Mullen, Karthik Ram, Noam Ross, Maëlle Salmon, Melina Vidoni. (2019, October 2). ropensci/dev_guide: Third release (Version 0.3.0). Zenodo. https://doi.org/10.5281/zenodo.2553043 ↩︎

