
April 2, 2019
 Importance of Hydrology
Given that liquid water is essential to life on Earth, water research cuts across numerous disciplines including hydrology, meteorology, geography, climate science, engineering, ecology, and more. Numerous R packages have emerged from this diversity of approaches, and we recently gathered many of them into a new rOpenSci task view which we broadly titled ‘Hydrology’ and published to CRAN. Our intent is to be exhaustive and compile R packages to access, model, and summarise information related to the movement of water across the Earth’s landscape. We hope to contribute to a nascent community of hydrological R users and develop an infrastructure of packages that provide a comprehensive toolkit for water practitioners who use R as their preferred computational analysis tool. Making sense of water data is critical to understanding the response of landscapes to a changing climate. Consolidating water-related packages will promote their usage and discovery and ultimately facilitate reproducible workflows for water research. Since this is a new task view, it serves our purpose to evaluate the current State of Hydrology in R and look at the interdependency of hydrology packages relative to some better known collections of packages in the general R ecosystem.
State of Hydrology in R
We will conduct a high-level assessment of the state of hydrology in R by visualizing network connectivity among package dependencies – which packages use code from another package to accomplish a task. For context, we will evaluate our Hydrology task view against one of the most well-known collection of packages in R, the tidyverse, as well as the venerable Environmetrics task view which includes many packages for environmental analysis. To do that we need to write some R code and load our required packages:

library(tidyverse)
library(tidygraph)
library(ggraph)
library(ctv)
library(tools)
library(cranlogs)
We will use the handy CRAN_package_db function from the tools package (part of base R) which conveniently grabs information from the DESCRIPTION file of every package on CRAN and turns it into a dataframe. Here we are only after a few columns so we will extract those right away:
all_cran_packages <- CRAN_package_db()[,c("Package", "Imports")]
We are also going to parse some of the info we receive from CRAN to make it a little easier to work with:
tidied_cran_imports <- as_tibble(all_cran_packages) %>%
  separate_rows(Imports, sep = ",") %>%
  mutate(Imports = str_replace(Imports,"\\s*\\([^\\)]+\\)","")) %>%
  mutate(Imports = str_trim(Imports, side = "both"))
Package Connectivity
First, let’s take a look at the tidyverse. We can take the rare step of actually using a function from the tidyverse package (appropriately named tidyverse_packages), which unsurprisingly identifies those packages officially belonging to the tidyverse. We filter for those packages and their imports, convert to tbl_graph and plot using ggraph to ultimately visualize package connectivity:
tidyverse_tbl <- tidied_cran_imports %>%
  filter(Package %in% tidyverse_packages()) %>%
  filter(Imports %in% tidyverse_packages()) %>%
  as_tbl_graph()

ggraph(tidyverse_tbl, layout = 'nicely') +
  geom_edge_link(colour = "grey50") +
  geom_node_text(aes(label = name), colour = "#F0F921FF", size = 6)
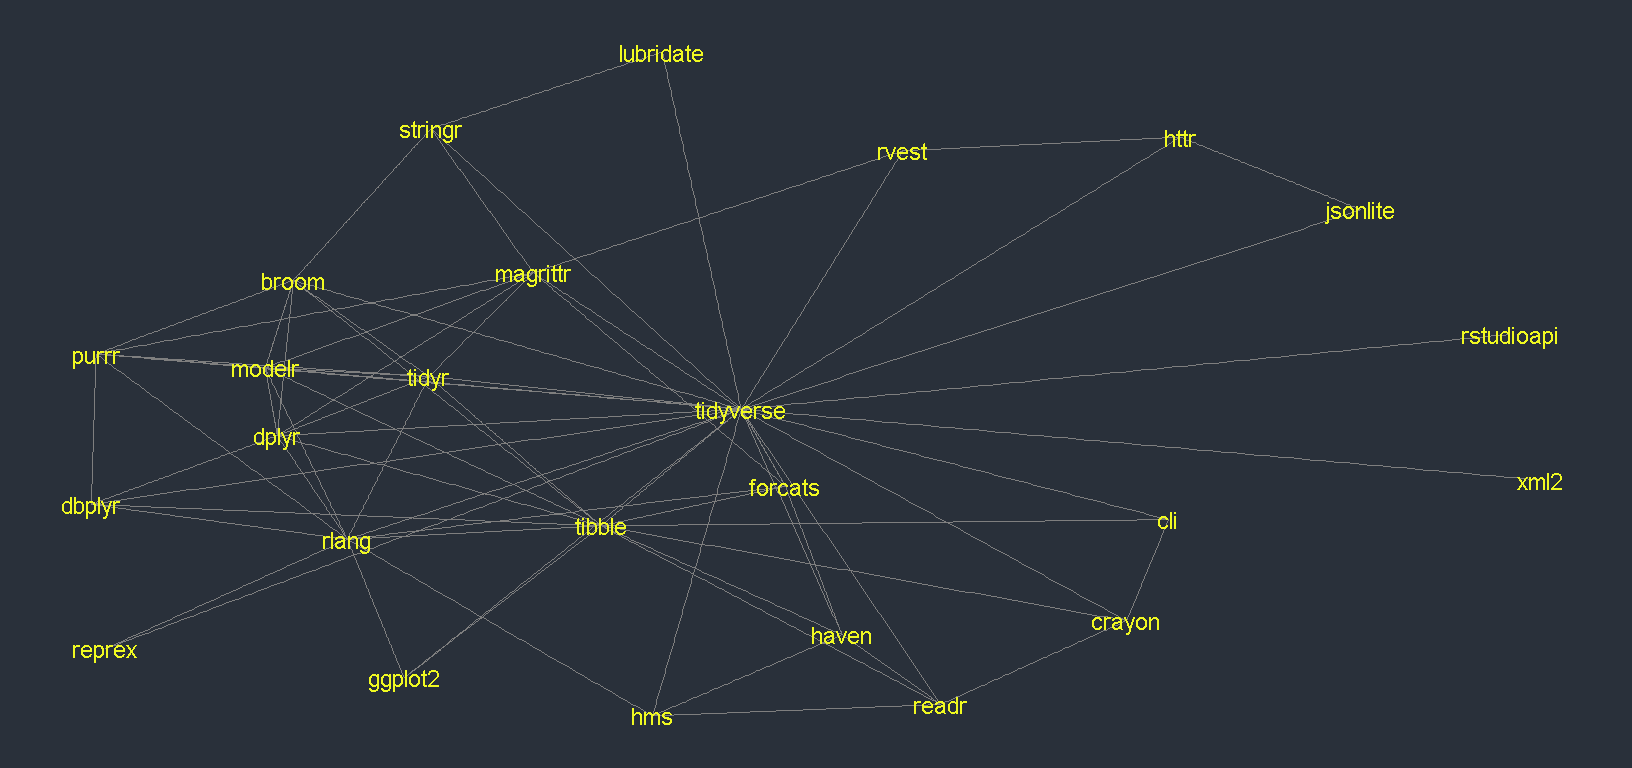
As you might expect, we see many intersecting lines traversing in all directions; many packages in the tidyverse import other packages in the tidyverse. This is expected as tidyverse development is coordinated.
Next, let’s have a look at the Environmetrics task view where we might not expect to see the same degree of connectivity. The ctv package, the infrastructure behind CRAN task views, (sort of) provides us with a function to access a vector of package names for a given task view, which we can use to similarly create a network plot:
env_packages <- ctv:::.get_pkgs_from_ctv_or_repos(views = "Environmetrics") %>%
  unlist(use.names = FALSE)

env_tbl <- tidied_cran_imports %>%
  filter(Package %in% env_packages) %>%
  filter(Imports %in% env_packages) %>%
  as_tbl_graph()

ggraph(env_tbl, layout = 'nicely') +
  geom_edge_link(colour = "grey50") +
  geom_node_text(aes(label = name), colour = "#FDB32FFF", size = 6)
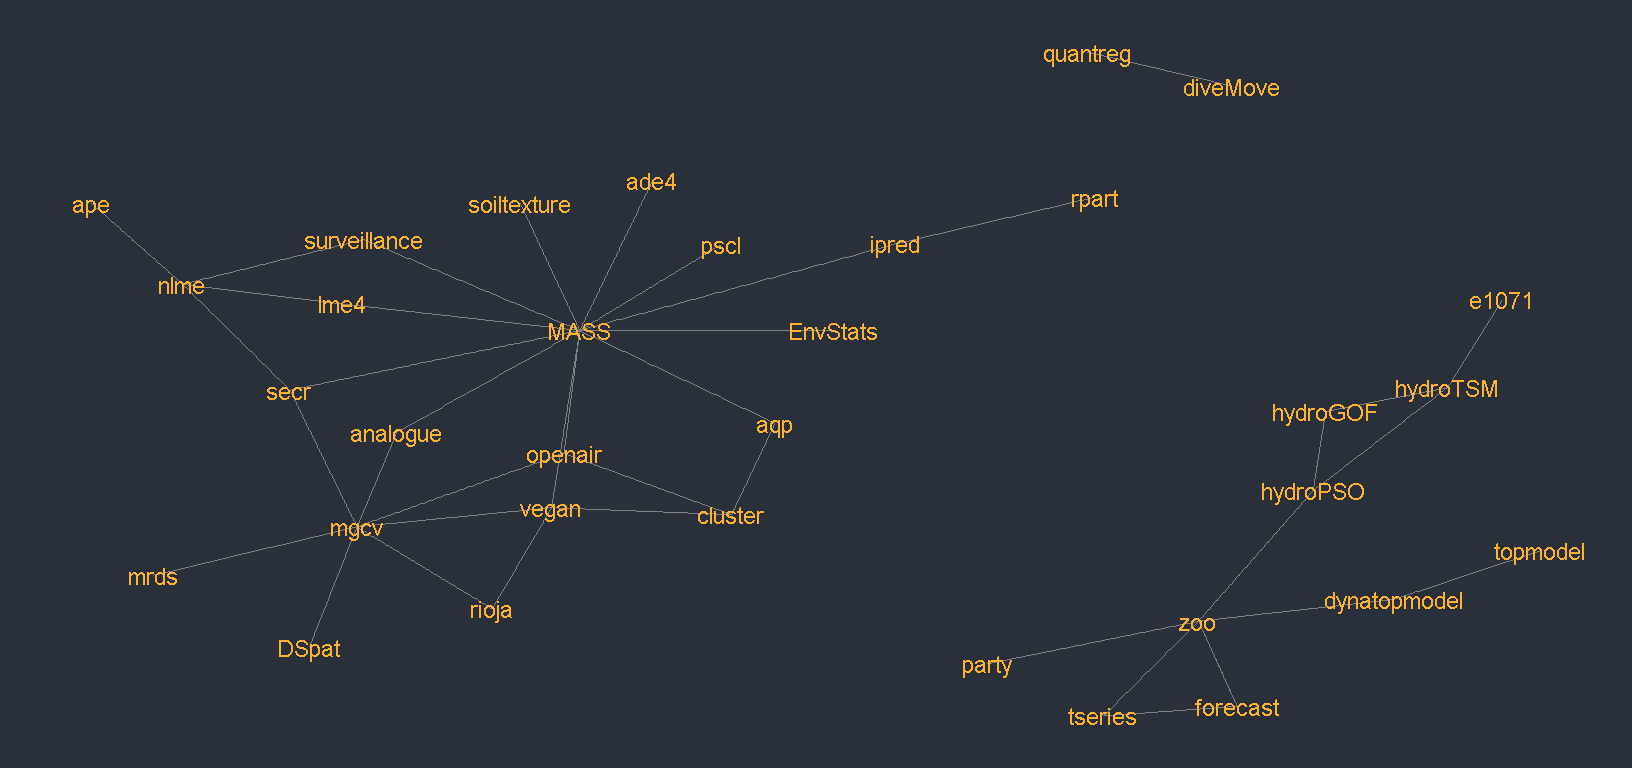
While there are clearly fewer connections than in the tidyverse package ecosystem, there is still quite a large amount of connectivity in Environmetrics task view In particular the mgcv, MASS, vegan and zoo packages all provide critical infrastructure for those developing packages in this field. This presumably can at least partially be attributed to the age (and therefore the maturity) of the Environmetrics task view.
Finally, we can evaluate the new Hydrology task view by a similar means:
hyd_packages <- ctv:::.get_pkgs_from_ctv_or_repos(views = "Hydrology") %>%
  unlist(use.names = FALSE)

hyd_tbl <- tidied_cran_imports %>%
  filter(Package %in% hyd_packages) %>%
  filter(Imports %in% hyd_packages) %>%
  as_tbl_graph()

ggraph(hyd_tbl, layout = 'nicely') +
  geom_edge_link(colour = "grey50") +
  geom_node_text(aes(label = name), colour = "#ED7953FF", size = 6)
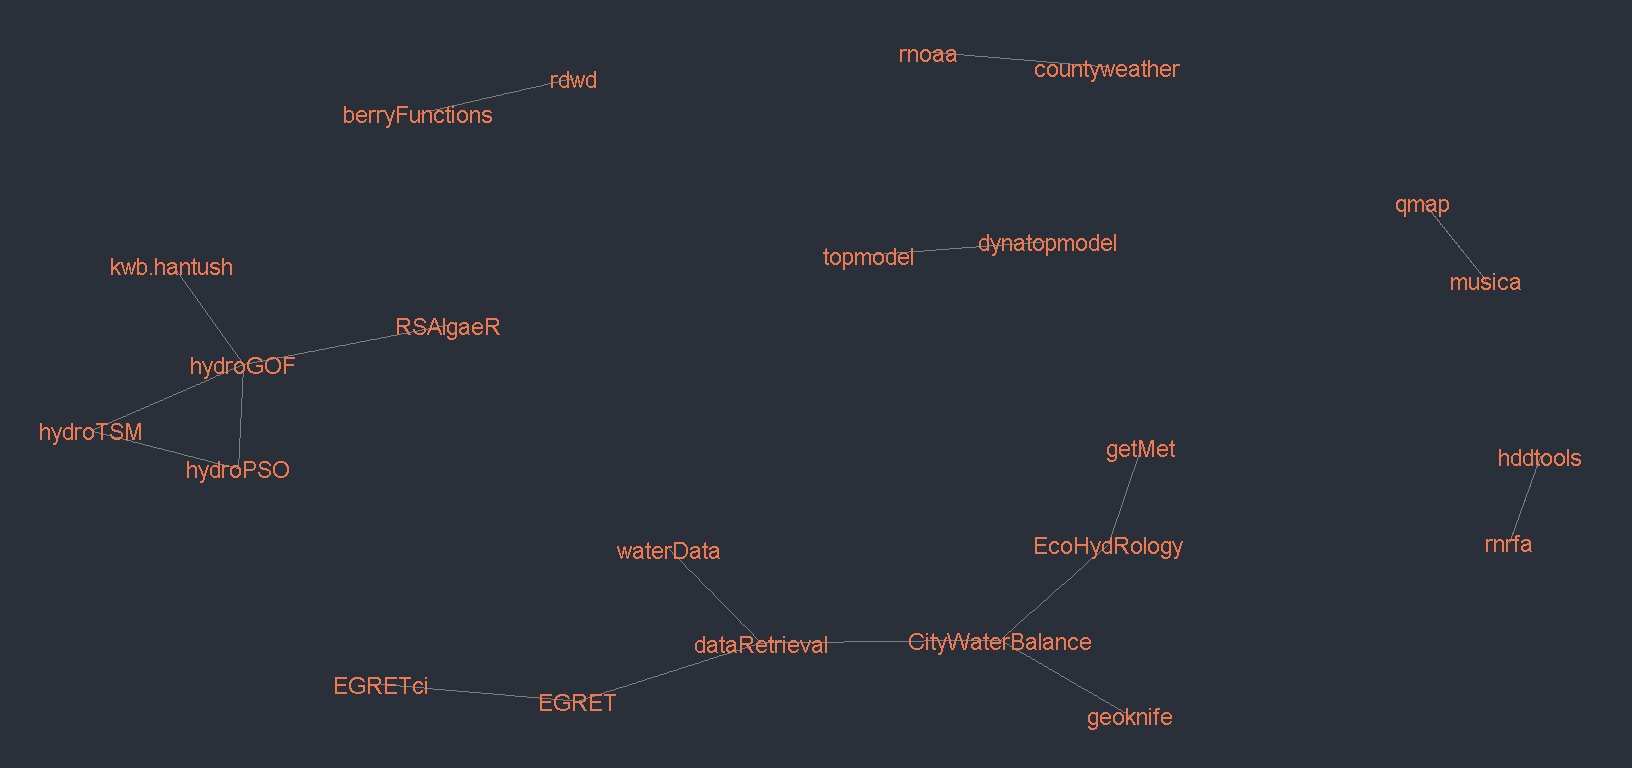
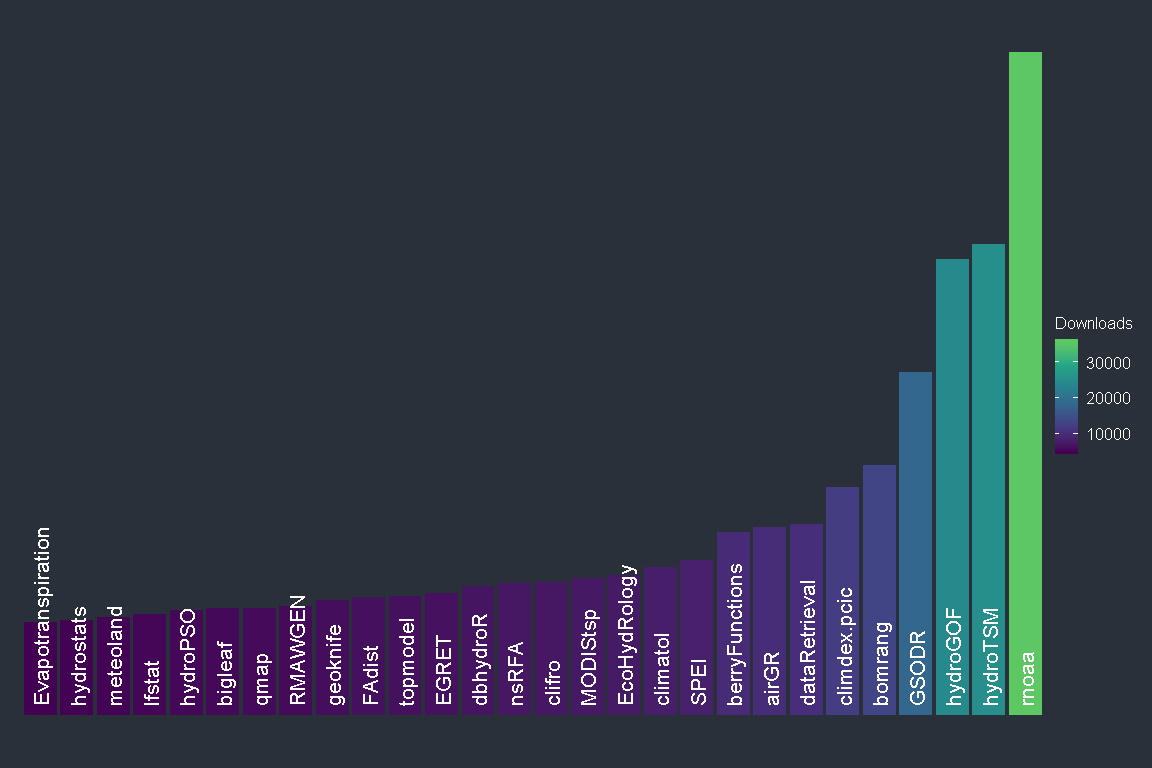
Clearly some connectivity among water-related packages is already happening, which serves as a reminder that CRAN task views aren’t the only place people discover packages to use. Some tools form a hub of connected packages because they share a common package maintainer (see hydroGOF) while others like CityWaterBalance draw upon a diverse suite of Hydrology packages to study urban water systems. Many rOpenSci packages have been included in the task view (bomrang, clifro, dbhydroR, GSODR, hddtools, hydroscoper, MODIStsp, rnoaa, smapr, tidyhydat, weathercan). rnoaa in particular is a key piece of infrastructure that underpins many analyses in hydrological research. The plot below summarises the number of downloads from the RStudio CRAN mirror over the past year via the cranlogs package.
pkgcount <- cran_downloads(packages = hyd_packages,
                           from = Sys.Date()-1*365,
                           to = Sys.Date()) %>%
  group_by(package) %>%
  summarise(downloads = sum(count)) %>%
  filter(downloads >= 5000)

pkgcount %>%
  ggplot(aes(x = reorder(package, downloads), y = downloads)) +
  geom_col(aes(fill = downloads)) +
  geom_text(aes(y = 1000, label = package), size = 5.5, colour = "white",
            hjust = 0, nudge_y = -500, angle = 90) +
  scale_fill_viridis_c(name = "Downloads", option = "D", end = 0.75)
It is illustrative that the top four packages feature two modelling packages and two data packages. These are the basic tenets of hydrological research and indicate how those in the hydrological space are using R.
Future of R for Hydrology
Hydrology, like many other sciences, is becoming more and more data driven and programmatic ways to access, manipulate and model data in a reproducible workflow are becoming a necessity. Water related data though has its own specific challenges, which are similar but different from those of other data sources. It can be expected that with a growing uptake of R in the hydrological community more packages will be available, with more interconnectivity between them. At the moment the landscape of R for hydrologists is quite fragmented, but in time it might be that some core packages to manipulate data will emerge and several computational approaches to hydrological models will be centralised in a unique package. Regardless of how the landscape of hydrology packages will evolve, R and open source tools are becoming increasingly relevant in the hydrological community, and we are happy to have made a small contribution to make it easier for everybody to know what can already be done with water data in R.
If the Hydrology CRAN task view can connect developers and hydrologists, we hope it can leverage the efforts of others in the hydrology space. A topic in R can live in many places without detracting from others. Twitter, Stack Overflow and GitHub are all obviously great places to strengthen the community of water practitioners using R. Our task view hopefully will join those spaces as a resource to enable shared efforts towards water management. You can contribute to the task view by opening an issue or pull request at our project repository.
