November 14, 2017
This year’s rOpenSci ozunconf was held in Melbourne, bringing together over 45 R enthusiasts from around the country and beyond. As is customary, ideas for projects were discussed in GitHub Issues (41 of them by the time the unconf rolled around!) and there was no shortage of enthusiasm, interesting concepts, and varied experience.
I’ve been to a few unconfs now and I treasure the time I get to spend with new people, new ideas, new backgrounds, new approaches, and new insights. That’s not to take away from the time I get to spend with people I met at previous unconfs; I’ve gained great friendships and started collaborations on side projects with these wonderful people.
When the call for nominations came around this year it was an easy decision. I don’t have employer support to attend these things so I take time off work and pay my own way. This is my networking time, my development time, and my skill-building time. I wasn’t sure what sort of project I’d be interested in but I had no doubts something would come up that sounded interesting.
As it happened, I had been playing around with a bit of code, purely out of interest and hoping to learn how htmlwidgets work. The idea I had was to make a classic graphic equaliser visualisation like this

using R.
This presents several challenges; how can I get live audio into R, and how fast can I plot the signal? I had doubts about both parts, partly because of the way that R calls tie up the session (for now…) and partly because constructing a ggplot2 object is somewhat slow (in terms of raw audio speeds). I’d heard about htmlwidgets and thought there must be a way to leverage that towards my goal.
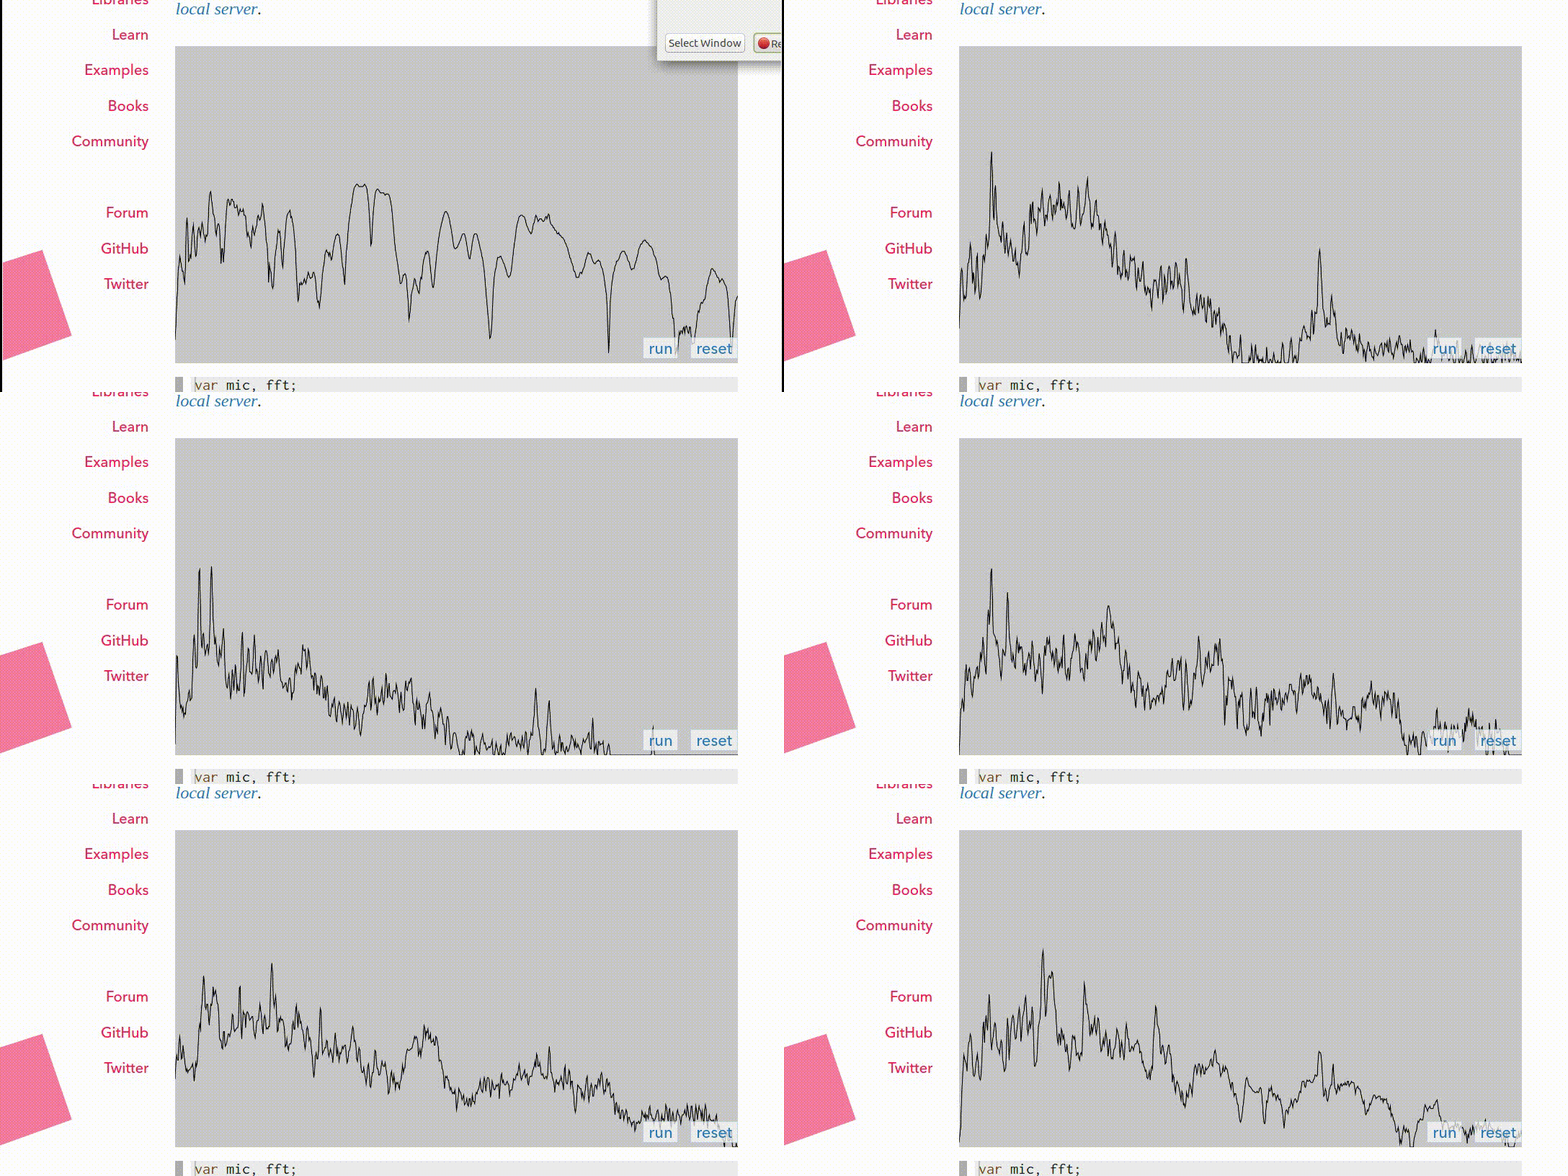
I searched for a graphic equaliser javascript library to work with and didn’t find much that aligned with what I had in my head. Eventually I stumbled on p5.js and its examples page which has an audio-input plot with a live demo. It’s a frequency spectrum, but I figured that’s just a bit of binning away from what I need. Running the example there looks like

This seemed to be worth a go. I managed to follow enough of this tutorial to have the library called from R. I modified the javascript canvas code to look a little more familiar, and the first iteration of geom_realtime() was born
This seemed like enough of an idea that I proposed it in the GitHub Issues for the unconf. It got a bit of attention, which was worrying, because I had no idea what to do with this next. Peter Hickey pointed out that Sean Kross had already wrapped some of the p5.js calls into R calls with his p5 package, so this seemed like a great place to start. It’s quite a clever way of doing it too; it involves re-writing the javascript which htmlwidgets calls on each time you want to do something.
Fast forward to the unconf and a decent number of people gathered around a little slip of paper with geom_realtime() written on it. I had to admit to everyone that the ggplot2 aspect of my demo was a sham (it’s surprisingly easy to draw a canvas in just the right shade of grey with white gridlines), but people stayed, and we got to work seeing what else we could do with the idea. We came up with some suggestions for input sources, some different plot types we might like to support, and set about trying to understand what Sean’s package actually did.
As it tends to work out, we had a great mix of people with different experience levels in different aspects of the project; some who knew how to make a package, some who knew how to work with javascript, some who knew how to work with websockets, some who knew about realtime data sources, and some who knew about nearly none of these things (✋ that would be me). If everyone knew every aspect about how to go about an unconf project I suspect the endeavor would be a bit boring. I love these events because I get to learn so much about so many different topics.
I shared my demo script and we deconstructed the pieces. We dug into the inner workings of the p5 package and started determining which parts we could siphon off to meet our own needs. One of the aspects that we wanted to figure out was how to simulate realtime data. This could be useful both for testing, and also in the situation where one might want to ’re-cast’ some time-coded data. We were thankful that Jackson Kwok had gone deep-dive into websockets and pretty soon (surprisingly soon, perhaps; within the first day) we had examples of (albeit, constructed) real-time (every 100ms) data streaming from a server and being plotted at-speed

Best of all, running the plot code didn’t tie up the session; it uses a listener written into the javascript so it just waits for input on a particular port.
With the core goal well underway, people started branching out into aspects they found most interesting. We had some people work on finding and connecting actual data sources, such as the bitcoin exchange rate

and a live-stream of binary-encoded data from the Australian National University (ANU) Quantum Random Numbers Server

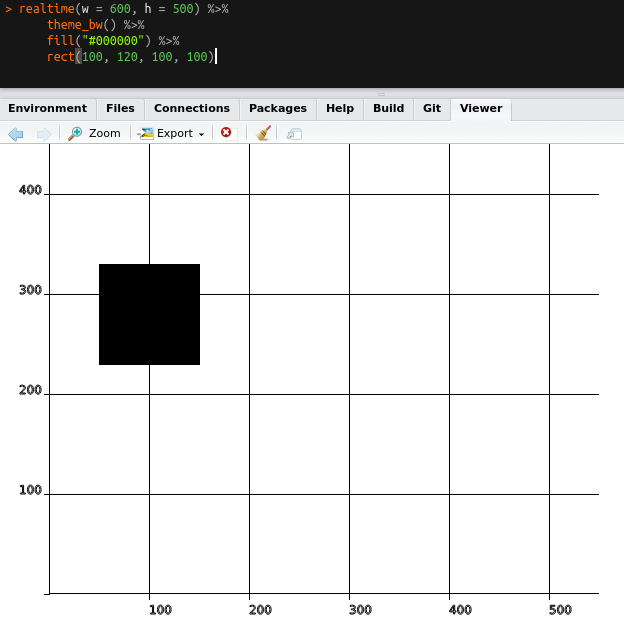
Others formalised the code so that it can be piped into different ‘themes’, and retain the p5 structure for adding more components

These were still toy examples of course, but they highlight what’s possible. They were each constructed using an offshoot of the p5 package whereby the javascript is re-written to include various features each time the plot is generated.
Another route we took is to use the direct javascript binding API with factory functions. This had less flexibility in terms of adding modular components, but meant that the javascript could be modified without worrying about how it needed to interact with p5 so much. This resulted in some outstanding features such as side-scrolling and date-time stamps. We also managed to pipe the data off to another thread for additional processing (in R) before being sent to the plot.
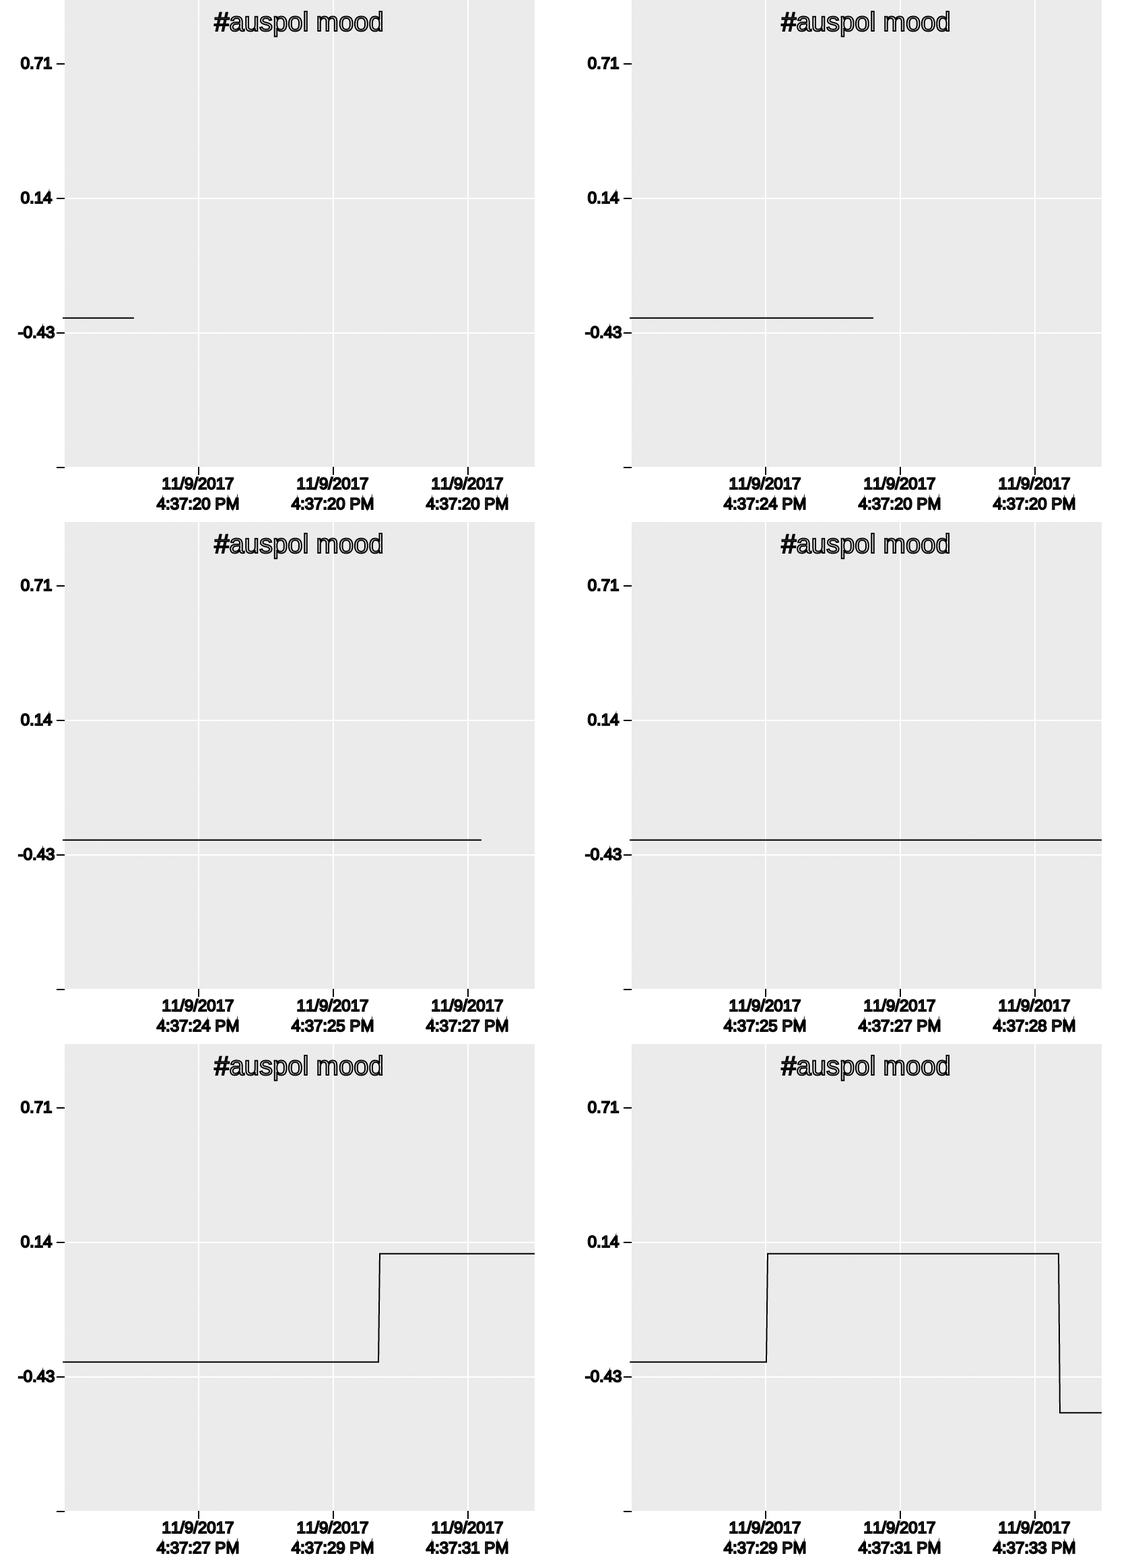
The example we ended up with reads the live-feed of Twitter posts under a given hashtag, computes a sentiment analysis on the words with R, and live-plots the result:

Overall I was amazed at the progress we made over just two days. Starting from a silly idea/demo, we built a package which can plot realtime data, and can even serve up some data to be plotted. I have no expectations that this will be the way of the future, but it’s been a fantastic learning experience for me (and hopefully others too). It’s highlighted that there’s ways to achieve realtime plots, even if we’ve used a library built for drawing rather than one built for plotting per se.
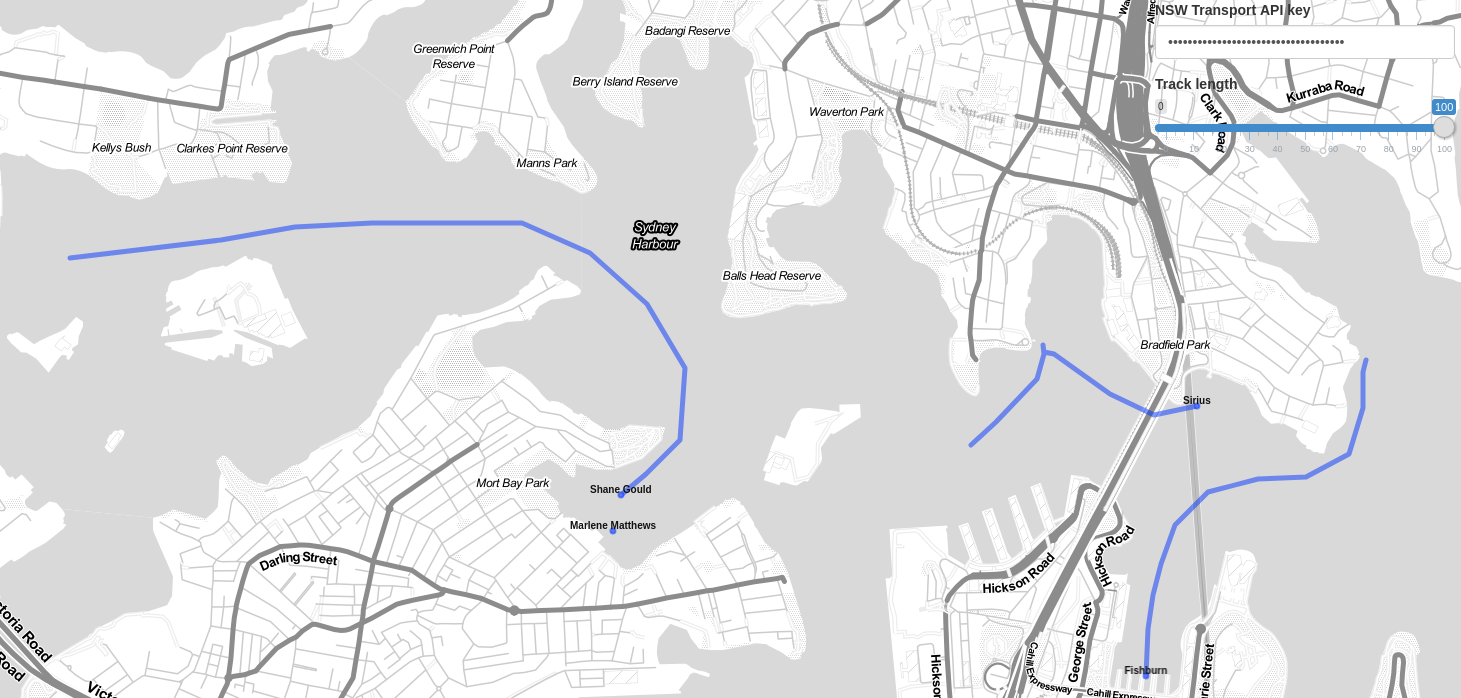
It’s even inspired offshoots in the form of some R packages; tRainspotting which shows realtime data on New South Wales public transport using leaflet as the canvas

and jsReact which explores the interaction between R and Javascript


The possibilities are truly astounding. My list of ‘things to learn’ has grown significantly since the unconf, and projects are still starting up/continuing to develop. The ggeasy package isn’t related, but it was spawned from another unconf Github Issue idea. Again; ideas and collaborations starting and developing.
I had a great time at the unconf, and I can’t wait until the next one. My hand will be going up to help out, attend, and help start something new.
My thanks and congratulations go out to each of the realtime developers: Richard Beare, Jonathan Carroll, Kim Fitter, Charles Gray, Jeffrey O Hanson, Yan Holtz, Jackson Kwok, Miles McBain and the entire cohort of 2017 rOpenSci ozunconf attendees. In particular, my thanks go to the organisers of such a wonderful event; Nick Tierney, Rob Hyndman, Di Cook, and Miles McBain.

